
How Technical Indicators Work
Indicators are mathematical formulas based on price and volume, which means they always lag. In this lesson, you'll learn about the two main indicator families, why stacking five of them adds zero value, and why price action always gets the final say.
How Indicators Work
Open any trading platform, and you'll find well over a hundred items in the list: RSI, MACD, Bollinger Bands, Stochastic, Ichimoku. A beginner's first instinct is often to dump them all onto the chart, hoping one will finally tell them when to buy. It won't. But once you understand what indicators are actually made of, they stop being treated like crystal balls and become genuinely useful tools.
An Indicator Is a Formula, Not a Prediction
Every indicator takes the exact same raw data you already see on the chart—open, high, low, and close prices (OHLC), plus in some cases—and runs it through a formula. It adds zero new information. An indicator simply repackages what has already happened into a different visual format.
The simplest example is a : the arithmetic mean of the closing prices over the last 20 candles. If the sum of those 20 closes is $2,000, the average is $100. As each new candle forms, the oldest price drops off the calculation and the newest one gets added.
This leads to the single most important takeaway: indicators always lag. A moving average cannot turn around until price has spent enough time moving in the new direction.
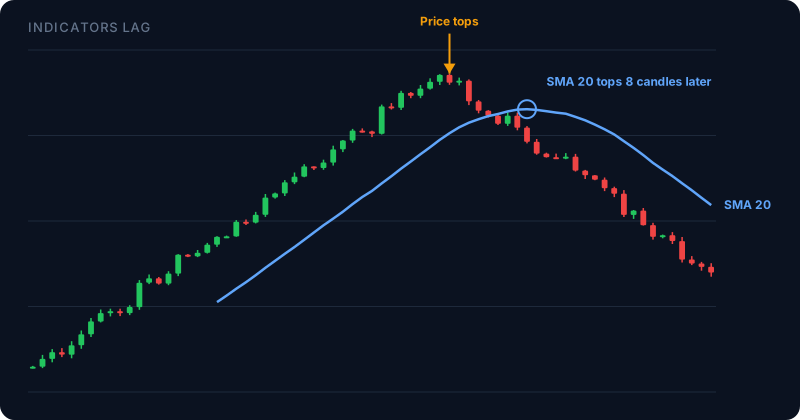
Lag isn't a defect you can "fix"—it's the mathematical cost of smoothing data. The smoother the line, the more it lags. A fast indicator lags less but generates plenty of false signals; a slow indicator is more reliable, but gives signals late. There is no perfect setting.
Get 5 USDT on your first RealStocks trade
Make a first RealStocks trade of at least 10 USDT and receive 5 USDT.
Affiliate link. MEXC pays us a commission at no extra cost to you. Trading carries a risk of losing your capital.